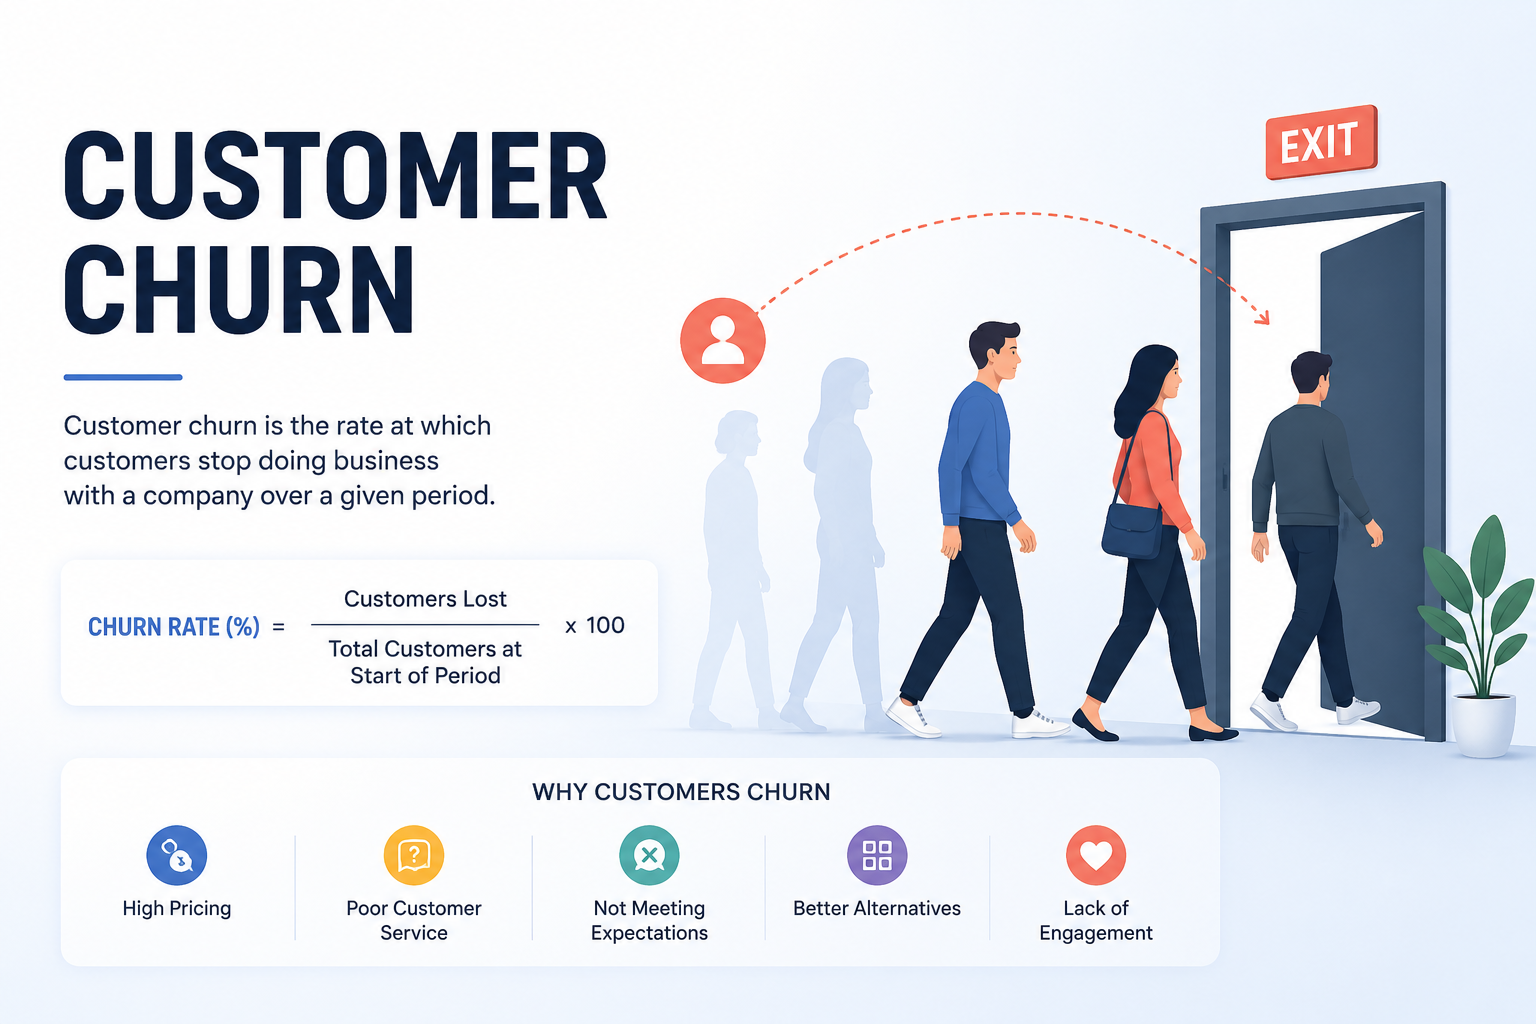
Customer churn is the silent revenue killer in subscription-based businesses. In telecom, where acquiring a new customer can cost five to ten times more than retaining an existing one, the ability to predict who is about to leave is nothing short of a superpower.
In this post, I'll walk you through an end-to-end machine learning project using the IBM Telco Customer Churn Dataset. We'll tackle the two biggest demons in classification: severe class imbalance and model interpretability. The weapon of choice? SMOTE for synthetic oversampling and XGBoost for high-performance, interpretable predictions.
The full code is available in this Github Repo — feel free to fork it and run it yourself.
1. The Data That Started It All
The IBM Telco dataset gives us a rich view of customer behavior: demographics, account tenure, contract types, service subscriptions, and billing information. But raw data is rarely ready for prime time.
Cleaning and Imputation
We encountered two immediate issues:
TotalChargeswas stored as a string. After coercing it to numeric, we found 11 missing values — all belonging to new customers with zero tenure. We imputed these with the median to avoid skewing the distribution.customerIDwas dropped — it offers no predictive value.
Feature Correlation
Before modeling, we checked how numeric features relate to each other. This helps us spot multicollinearity and understand the data structure.
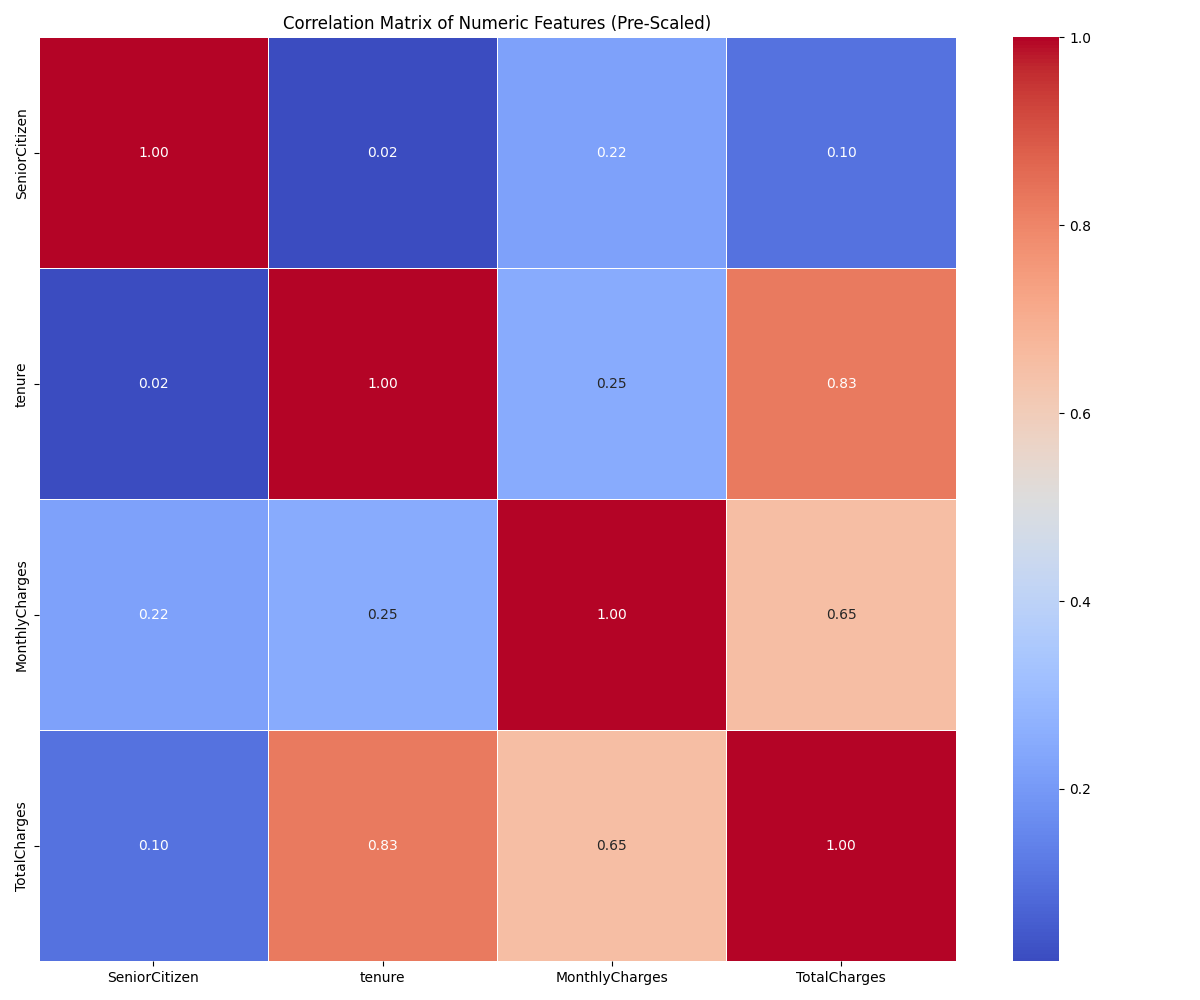
Caption: Correlation matrix showing the strong relationship between tenure and TotalCharges (0.83). MonthlyCharges and TotalCharges also share a moderate correlation (0.65).
2. The Imbalance Problem (and Why SMOTE Fixes It)
In the original dataset, only ~26% of customers churned. The rest didn't. If we train a model on this data, it will become lazy — predicting "No Churn" for almost everyone to achieve high accuracy while missing the very customers we care about most.
3. Modeling: XGBoost + Hyperparameter Tuning
We chose XGBoost for its speed, accuracy, and built-in regularization. But even the best algorithm needs the right settings.
Preprocessing Pipeline
- One-Hot Encoding: Categorical features were encoded with
drop_first=Trueto avoid dummy variable traps. - Standardization: Numeric features (
tenure,MonthlyCharges,TotalCharges) were scaled usingStandardScaler. Critical step: we fit the scaler only on training data to prevent data leakage.
Grid Search for Optimal Parameters
We ran a GridSearchCV with 3-fold cross-validation, optimizing for ROC-AUC (which handles imbalance better than accuracy).
Best Parameters Found:
colsample_bytree: 0.8learning_rate: 0.1max_depth: 5n_estimators: 200subsample: 0.8
Best Cross-Validation ROC-AUC: 0.9234 — a strong signal that our model is learning meaningful patterns.
4. Results: How Well Did We Predict?
We evaluated the optimized model on a 20% holdout test set (stratified to maintain the original distribution). Here are the final metrics:
| Metric | Score |
|---|---|
| Accuracy | 0.7729 |
| Precision | 0.5672 |
| Recall | 0.6096 |
| F1-Score | 0.5876 |
| ROC-AUC | 0.8211 |
Why Recall Matters Most
In churn prediction, Recall (0.61) is our north star. It means we caught 61% of actual churners before they left. Missing a churner costs revenue; a false positive (contacting a loyal customer) is a minor inconvenience. This trade-off is acceptable and business-savvy.
5. Visualizing Model Performance
Confusion Matrix
The confusion matrix gives us a granular view of where the model succeeds and struggles.
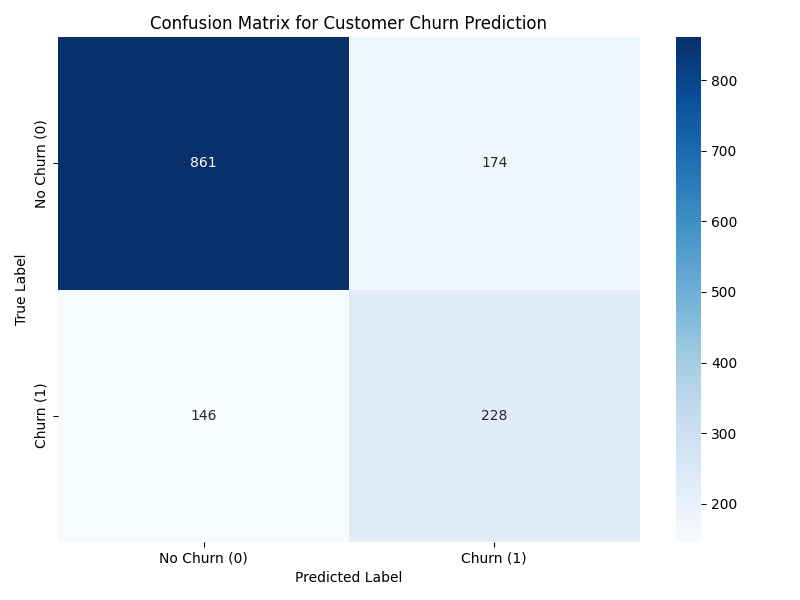
Caption: The model correctly identified 228 churners (bottom-right) and 861 non-churners (top-left). It missed 174 churners (false negatives) and flagged 146 loyal customers as churn risks (false positives).
ROC Curve
The ROC curve visualizes the trade-off between True Positive Rate (Recall) and False Positive Rate. Our AUC of 0.8211 confirms the model has excellent discriminatory power.
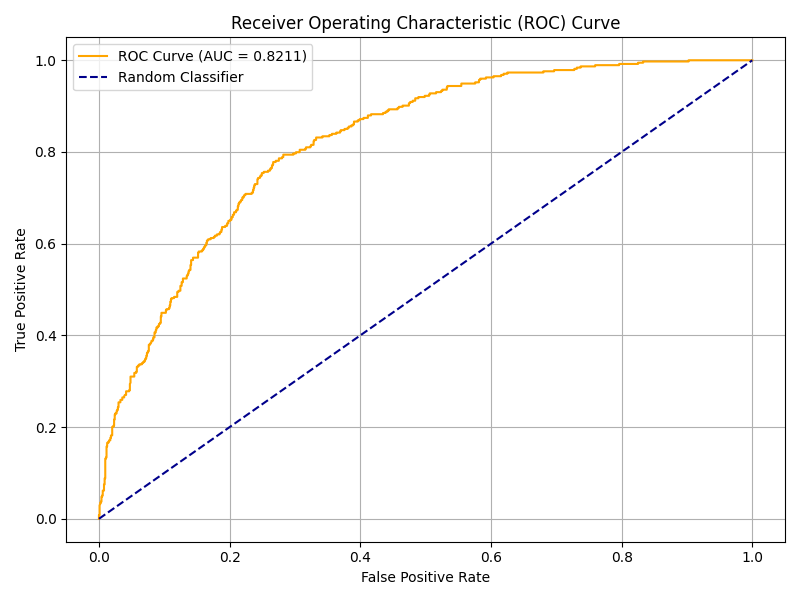
Caption: The blue curve sits well above the diagonal (random classifier), confirming strong predictive performance across all thresholds.
6. Feature Importance: Why Do Customers Actually Leave?
This is where the magic happens for business stakeholders. XGBoost provides built-in feature importance, revealing the drivers of churn.
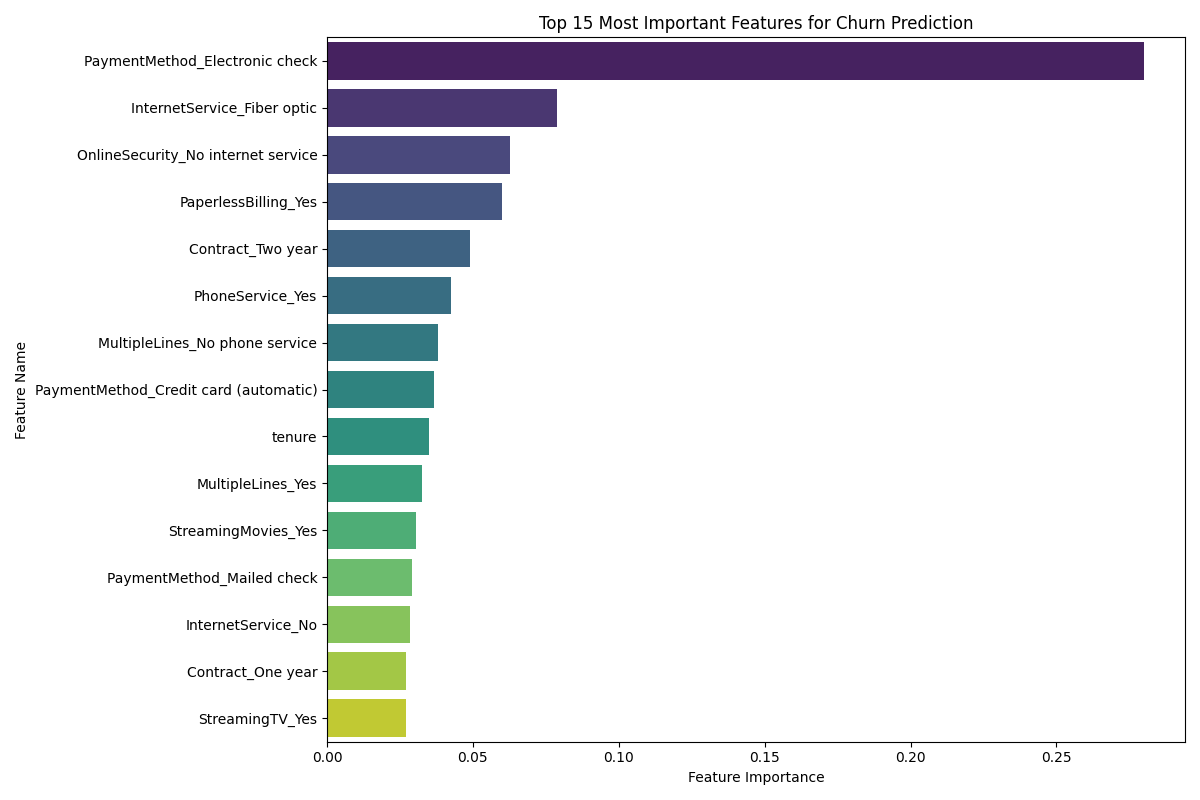
Caption: The top 10 features driving churn. Payment Method (Electronic check) and Fiber optic internet dominate the list.
Key Insights for Retention Teams
- Electronic Check Payments are the #1 churn indicator (importance score 0.28). Customers using electronic checks are far more likely to churn than those on automatic credit card payments.
- Fiber Optic Internet is the second-largest driver. While it's a premium service, it may come with higher prices or service issues that push customers away.
- No Online Security and Paperless Billing also rank high. Customers without security add-ons feel less protected, and paperless billing correlates with lower engagement (out of sight, out of mind).
Actionable Takeaways:
- Target electronic check users with incentives to switch to automatic payments.
- Bundle security services at a discount to increase stickiness.
- Engage new Fiber optic customers with proactive support during the first three months.
7. The Full Workflow
To ensure reproducibility and clarity, we mapped out the entire data preprocessing and modeling pipeline.
Image: /assets/images/workflow_flowchart.png — A flowchart showing raw data → cleaning → SMOTE → scaling → tuning → evaluation]**
8. Conclusion & Next Steps
This project delivered a production-ready churn prediction model with a solid ROC-AUC of 0.821. More importantly, the feature importance analysis gives business teams a roadmap for intervention.
What We Accomplished
- Handled imbalance effectively with SMOTE.
- Achieved high recall (61%) — catching the majority of at-risk customers.
- Identified actionable drivers — payment methods, contract types, and service gaps.
What's Next?
- Real-time Scoring: Deploy the model via a REST API to score customers daily.
- Retention Campaign A/B Testing: Use model scores to segment customers and test different intervention strategies.
- Model Drift Monitoring: Retrain regularly as customer behavior evolves.
Data science doesn't stop at predictions — it's about driving decisions. This model gives you the map; the retention team just needs to drive.
Full code and interactive notebook available here: Google Colab Link.